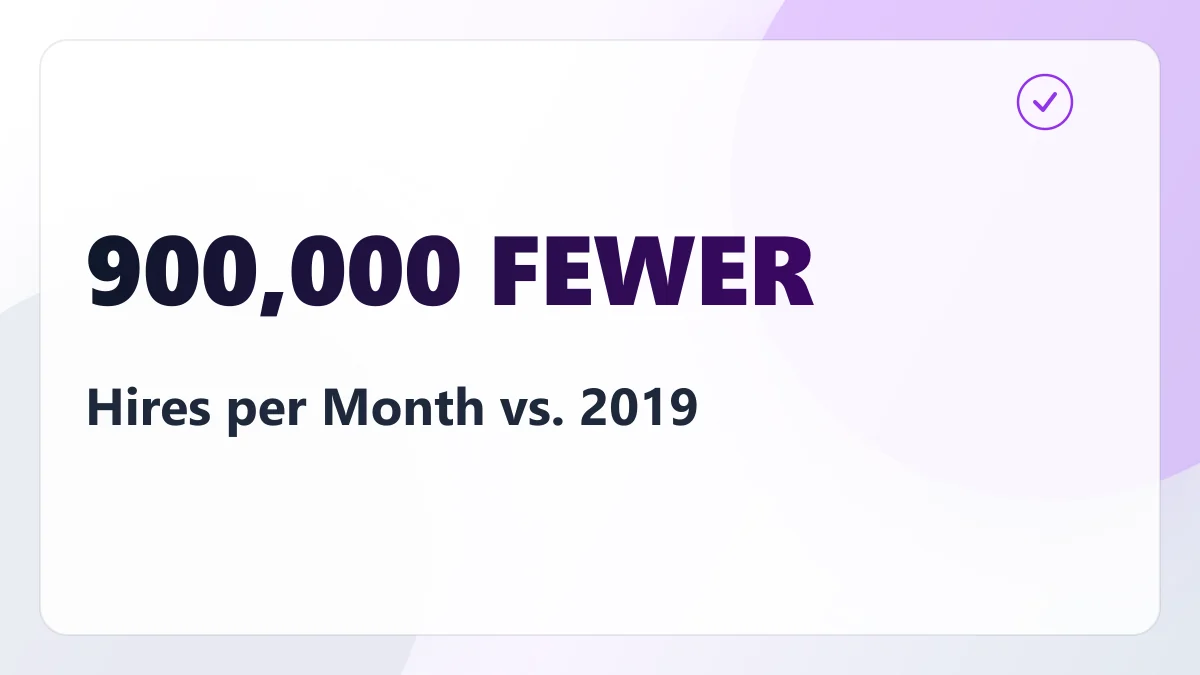
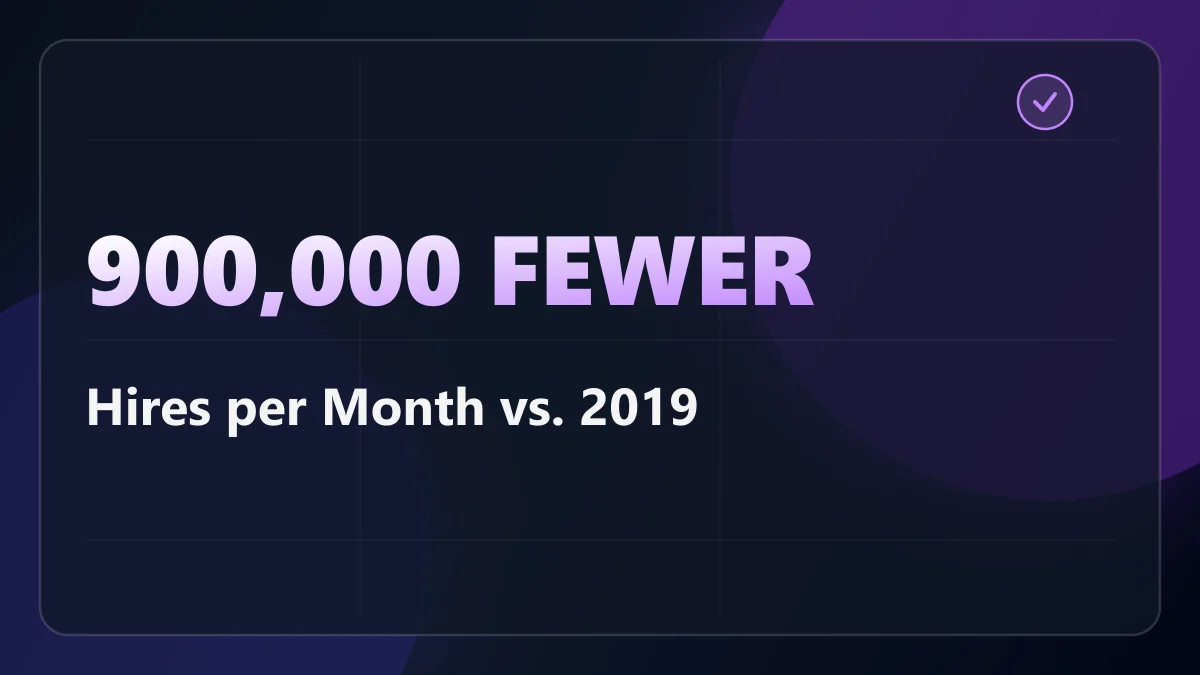
In July 2026, American employers were sitting on 7.3 million open jobs, slightly more than the 7.2 million they had open in July 2019. That month they hired 5.1 million people, against 6.0 million in July 2019 (JOLTS, September 1, 2026; JOLTS, September 10, 2019).
Same number of doors. Nine hundred thousand fewer people walking through them each month.
The Number Everyone Quotes Is the One That Has Not Changed
Job openings are the labor-market statistic that makes the headlines, and by that measure 2026 looks like 2019. Every other flow in the same report has fallen.
| Measure, July | 2019 | 2026 | Source |
|---|---|---|---|
| Job openings | 7.2 million (4.5%) | 7.3 million (4.4%) | 2019 · 2026 |
| Hires | 6.0 million (3.9%) | 5.1 million (3.2%) | 2019 · 2026 |
| Quits | 3.6 million (2.4%) | 3.1 million (1.9%) | 2019 · 2026 |
| Layoffs and discharges | 1.8 million (1.2%) | 1.7 million (1.0%) | 2019 · 2026 |
Both releases are the BLS Job Openings and Labor Turnover Survey for the month of July, five years apart.
Read down the right-hand column and the shape is clear. Employers are not firing at unusual rates. The layoff rate is lower than it was in 2019, which is the fact that keeps getting mistaken for good news. Employers are also barely hiring, and workers have stopped quitting, which is what people do when they suspect the next job will be hard to find.
This is not a market shedding workers. It is a market that has stopped moving.
What a Low Hiring Rate Costs You, in Weeks
The consequence lands on whoever is already out of work. If layoffs are the tap filling the pool and hires are the drain emptying it, a slow drain raises the water even when the tap is barely running.
That is exactly what the unemployment data shows. In July 2019, 1.2 million people had been jobless for 27 weeks or more, 19.2% of everyone unemployed (Employment Situation, August 2, 2019). In July 2026 it was 1.8 million, and 25.5% (Employment Situation, August 7, 2026). One in five became one in four.
Twenty-seven weeks is not an arbitrary threshold. It is past the point where the money stops. Of the six states in our benefit data, California, New York, Texas and Washington pay a maximum of 26 weeks, Florida pays 12, and only Massachusetts, at 30 weeks, still pays anything in week 27. We put the full state comparison in what unemployment pays and for how long, state by state.
So the statistical definition of long-term unemployment now begins, for most people, one week after their last check.
If You Have a Job
The quits rate is the tell. At 1.9%, against 2.4% in July 2019 (JOLTS, September 1, 2026; JOLTS, September 10, 2019), fewer of your colleagues are leaving voluntarily, which means fewer backfills, fewer internal moves and fewer of the vacancies that turn into promotions.
The practical read: an internal move or a raise negotiated where you are is worth more this year than it was two years ago, because the outside offer that normally backs it is slower to arrive. Do not resign without one in writing. In a 3.2% hiring market the gap between jobs is the expensive part, not the salary difference between them.
If You Are Looking
The openings are real. The conversion from opening to hire is what has broken, and no amount of applying fixes a hiring rate.
What you can control is the length of runway you are working with, so measure that first and search second. If you are leaving with severance, the severance runway calculator puts your payout, your state’s weekly benefit and its maximum weeks into one timeline, so you can see the week the money actually runs out rather than guessing at it. Budget for a search longer than the last one you ran, and remember that the benefit itself is taxable income the state probably is not withholding on, which we covered in what unemployment benefits do to your tax bill.
What Friday Changes
The August Employment Situation lands Friday, September 4 at 8:30 a.m. Eastern (BLS release schedule). The headline unemployment rate will get the coverage. Two other lines matter more for anyone reading this.
The first is the payroll change, which was -23,000 in July (Employment Situation, August 7, 2026). The second is the long-term share, at 25.5% and rising. A falling unemployment rate alongside a rising long-term share is not a recovery. It means people are leaving the count rather than finding work.
The Bottom Line
Openings are back at 2019 levels and hiring is not, and the difference is roughly 900,000 people a month who would have started a job in the old market and did not in this one. The risk in 2026 is not that you get laid off. It is that if you do, or if you choose to move, you sit out a good deal longer than the last time you looked.
Plan the runway before the search. We took the same picture apart from the employer’s side in layoffs at a two-year low while payrolls still shrank, and from the benefits side in only about one in four unemployed Americans is collecting. The duration side of it caught up in August: the unemployment rate fell over the year while the 27-weeks-and-over group did not move at all.
