US employers added 162,000 jobs in August and the unemployment rate stayed at 4.1 percent, down from 4.3 percent a year earlier (Bureau of Labor Statistics, September 4, 2026). Over that same year, the number of people out of work for 27 weeks or more went from 1,924,000 to 1,930,000 (BLS Table A-12).
The pool of unemployed people got smaller by about 400,000. The long-term half of it did not move at all.
Every bit of the improvement sits in one row
Here is the same population sorted by how long each person has been looking, August against August.
| How long out of work | Aug 2025 | Aug 2026 | Change |
|---|---|---|---|
| Less than 5 weeks | 2,475,000 | 2,000,000 | −475,000 |
| 5 to 14 weeks | 2,058,000 | 2,077,000 | +19,000 |
| 15 to 26 weeks | 1,051,000 | 1,147,000 | +96,000 |
| 27 weeks and over | 1,924,000 | 1,930,000 | +6,000 |
Both columns are seasonally adjusted and come from the same table of the monthly release (BLS Table A-12).
Read the change column downward. The top row falls hard. The bottom three do not fall at all, and two of them rise. A headline rate that improves on the strength of its first row is describing a slower intake, not a faster exit.
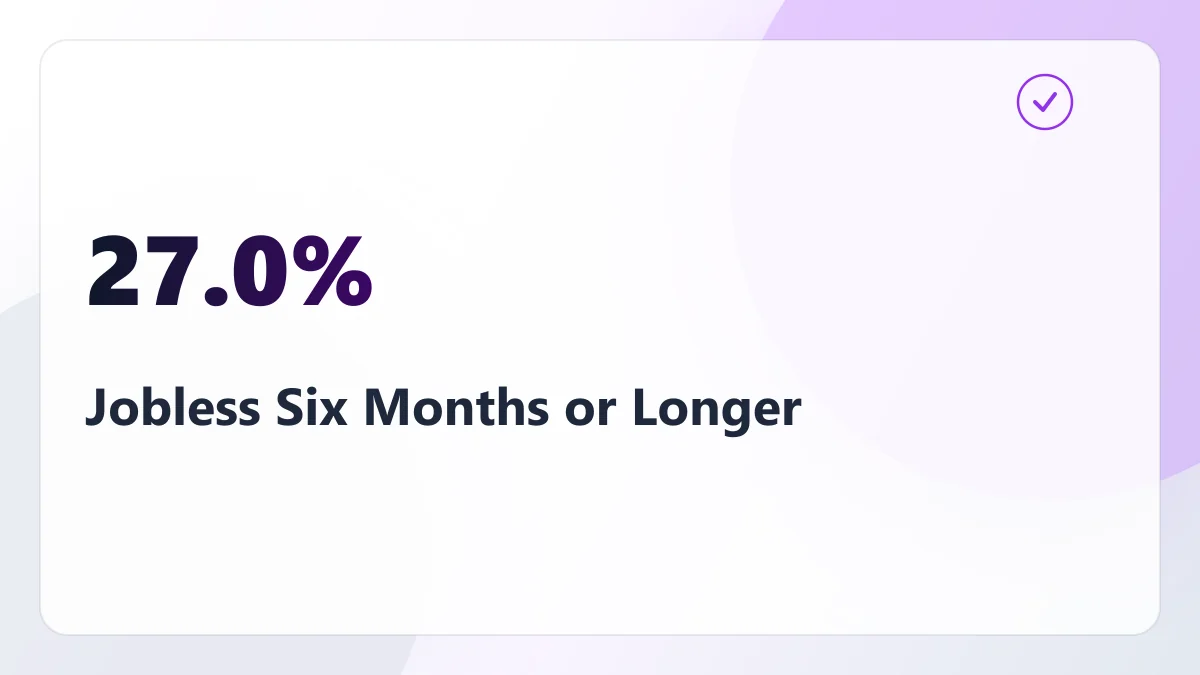
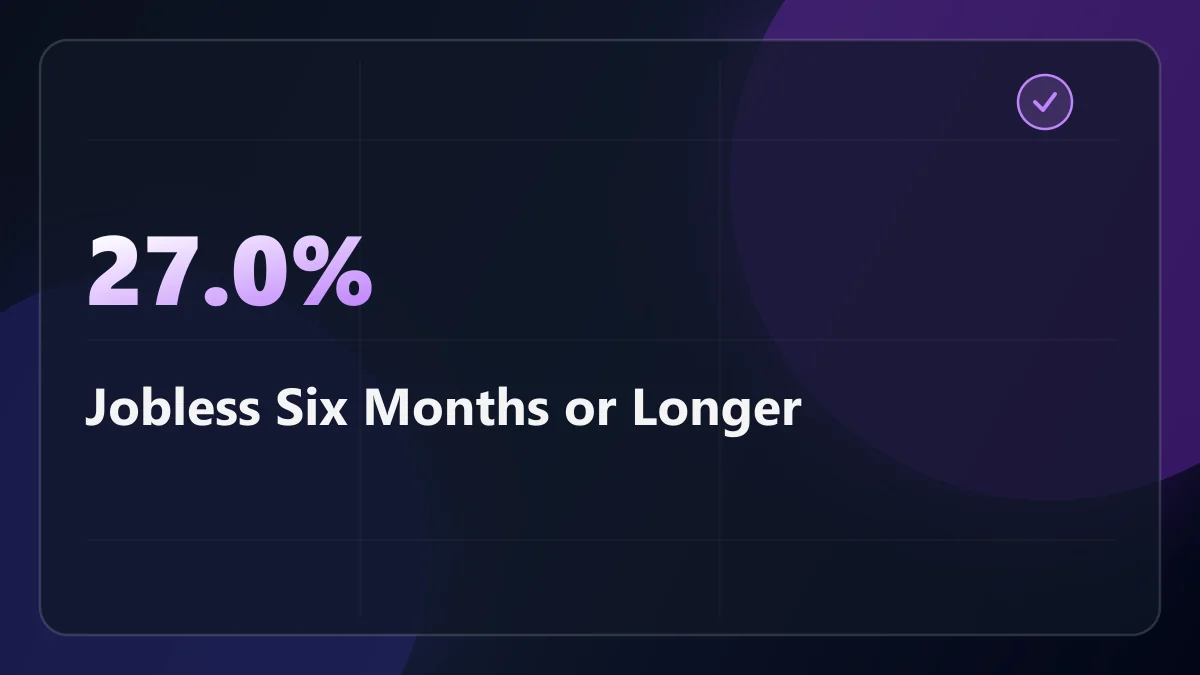
That arithmetic is why the share moved. People jobless 27 weeks or more were 25.6 percent of all unemployed in August 2025 and 27.0 percent in August 2026 (BLS Table A-12). The numerator held still while the denominator shrank.
The median is the number that sets your budget
Half of everyone unemployed in August had been looking for 11.4 weeks or longer. A year earlier the same midpoint sat at 9.9 weeks (BLS Table A-12).
The mean tells you about the tail rather than the middle, and it moved too, from 24.5 weeks to 26.3 (BLS Table A-12).
A week and a half at the midpoint sounds like a rounding error. It is ten more days of a search that has to be funded, and it arrived in a year the headline rate spent improving.
Fewer people falling in, not more climbing out
August’s household survey supports the same reading from a different direction. The number of job losers fell by 64,000 over the month, and the number of people working part time because they could not find full-time work fell by 414,000, to 4.4 million (Bureau of Labor Statistics, September 4, 2026).
Both of those are genuinely good numbers, and they belong in the picture. Fewer people are being pushed out of full-time work. Labor force participation edged up to 61.6 percent (Bureau of Labor Statistics, September 4, 2026).
What none of them describes is the exit rate for someone already six months in. That group has now spent a full year not shrinking, through two reports that were both received as improvements. We measured the same blockage from the employer side in more job openings than 2019, 900,000 fewer hires a month: the doors are open, and fewer people are walking through them.
Where the 162,000 actually came from
Food services and drinking places added 59,000 jobs. Local government education added 42,000. Manufacturing added 16,000 and health care 13,000. Information lost 23,000 (Bureau of Labor Statistics, September 4, 2026).
Professional and business services was on the list of industries showing little change over the month (Bureau of Labor Statistics, September 4, 2026), a flat month for the category that has been losing hiring volume without losing payroll headcount, the pattern we took apart in 188,000 fewer hires in a single month.
The revisions were friendlier than the recent run. June went from +20,000 to +31,000, and July from −23,000 to +21,000 (Bureau of Labor Statistics, September 4, 2026). July is no longer a month in which the country lost jobs.
Wages rose 10 cents to $37.75 an hour, up 3.1 percent over the year (Bureau of Labor Statistics, September 4, 2026). Two industries carried most of the month’s job growth, and neither restaurants nor school districts is where a laid-off information sector worker lands next.
The comparison that costs money
Most states pay unemployment benefits for a maximum of 26 weeks. Florida pays 12. Massachusetts pays 30. We put the whole table together in the state-by-state benefit duration file, and the spread across states is worth more than the weekly amount most people compare.
Now set that against August. Florida’s benefit runs 12 weeks; the national median search in August was 11.4. And 27.0 percent of unemployed Americans are already past 27 weeks, which is past the point where a standard 26-week state benefit has stopped paying entirely.
That is the practical content of this report. The risk is no longer mainly the chance of losing the job. It is the length of the gap afterwards, measured against a benefit calendar that was built for a shorter one.
What to do with a report like this
- The rate improved because fewer people entered unemployment, not because more people left it.
- The 27-weeks-and-over group has been flat at about 1.9 million for a year, and it is now 27.0 percent of the unemployed.
- The median search is 11.4 weeks and rising, which is within days of the shortest state benefit in the country.
- The month’s hiring was concentrated in food service and local government education. Information shed 23,000.
If you are employed and reading this as weather, the useful move is to price your own gap rather than the national one. Take your state’s maximum weeks, take your severance if you have one, and see how far the two of them actually reach with the severance runway calculator. If you are already collecting, there is a second bill waiting that nobody withholds for you: unemployment benefits are federally taxable and nothing comes out unless you ask.
Eleven point four weeks is the middle of the distribution. Plan for the half of it that runs long.
